Fake Software Abusing Real Software For Fun And Profit - Part 1!
Today I want to look at an interesting infection that abuses legitimate software in an attempt to stay covert and perform malicious activity, unnoticed.
To start, let’s break down the following diagram of the infection chain:
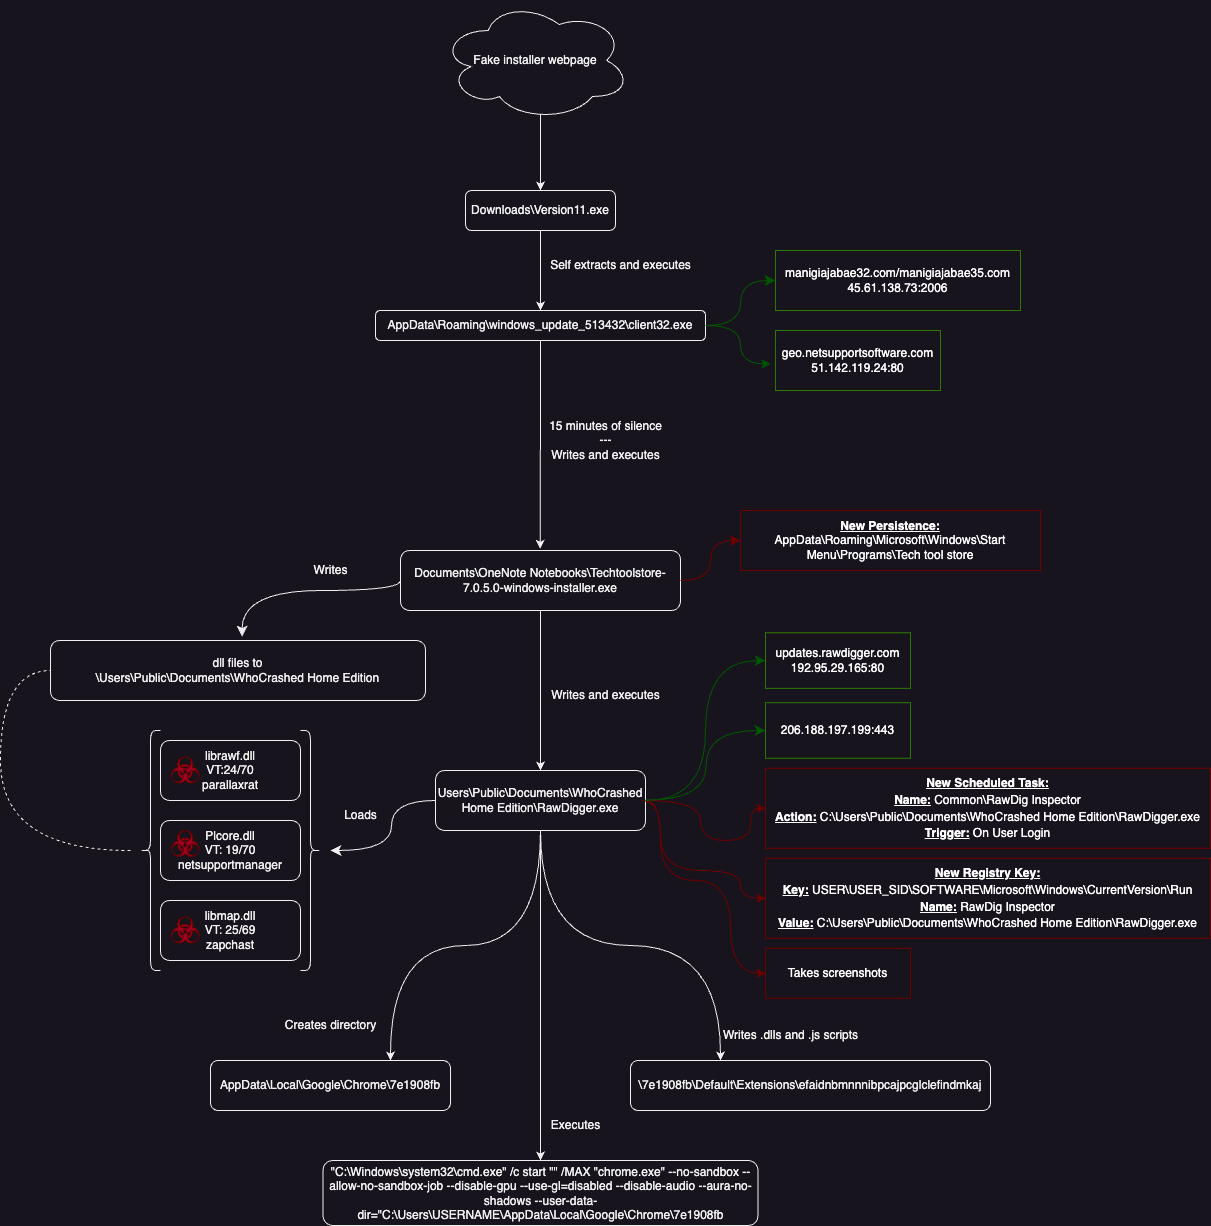
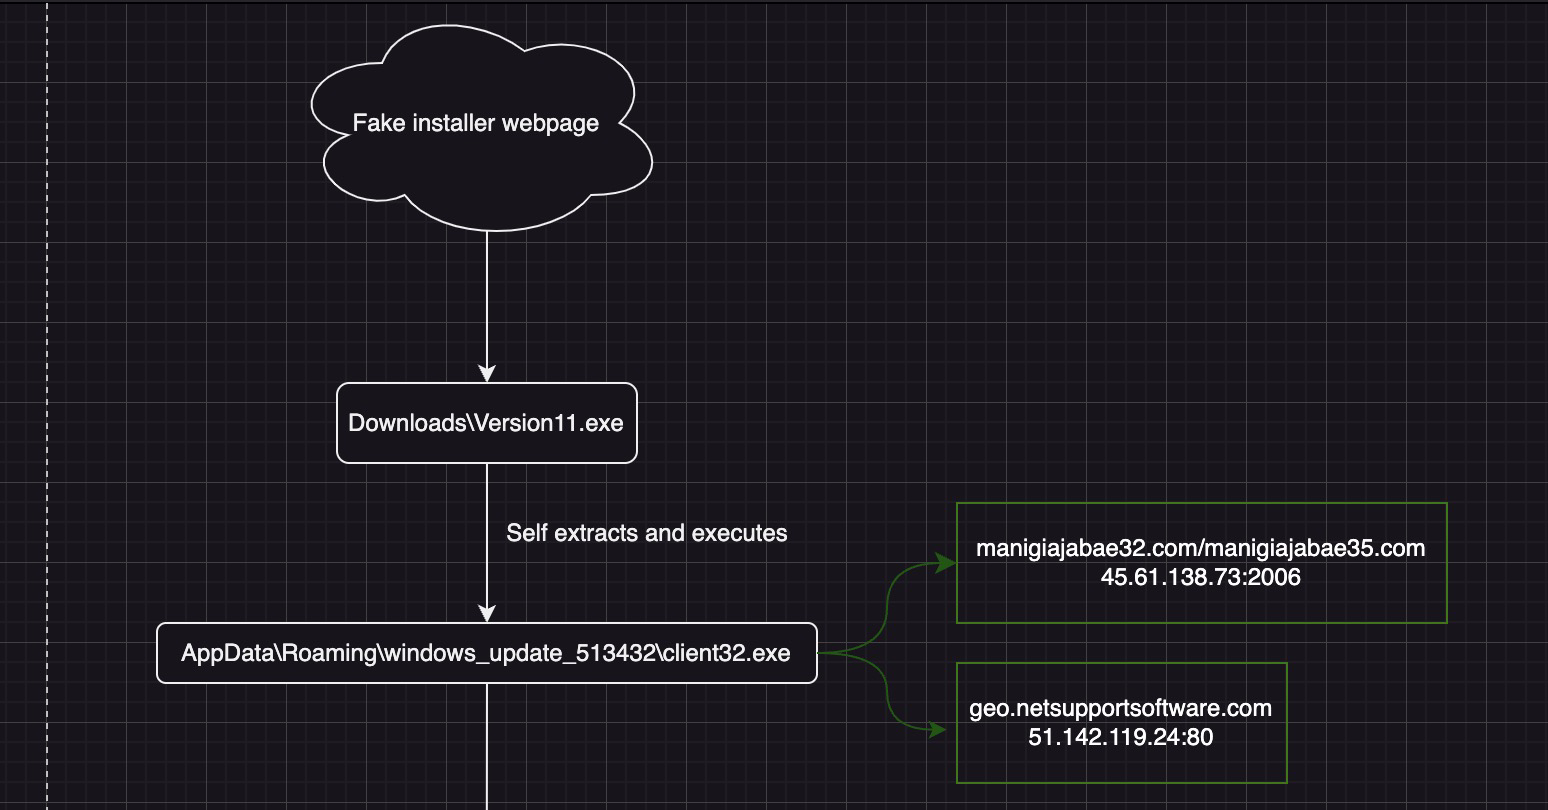
The source of the infection was most likely a fake software install webpage, although this is unverified. Indicators such as file name, and published research around this malware family give me high confidence this is the case.
The first action we see is a download of ‘Version11.exe’. This .exe is a simple self-extracting archive. When executed by the user, it will drop its content to the Appdata\Roaming\windows_update_513432 folder.
The contents?
client32.exe - otherwise known as NetSupport Rat! A popular choice among cyber crime participants, due to its nature as a legitimate tool.
We then see client32.exe(NetSupport) contact a C2 server and a legitimate NetSupport domain(interesting indicator!).
It was at this stage that Crowdstrike alerted on client32.exe, however it did not block the process.
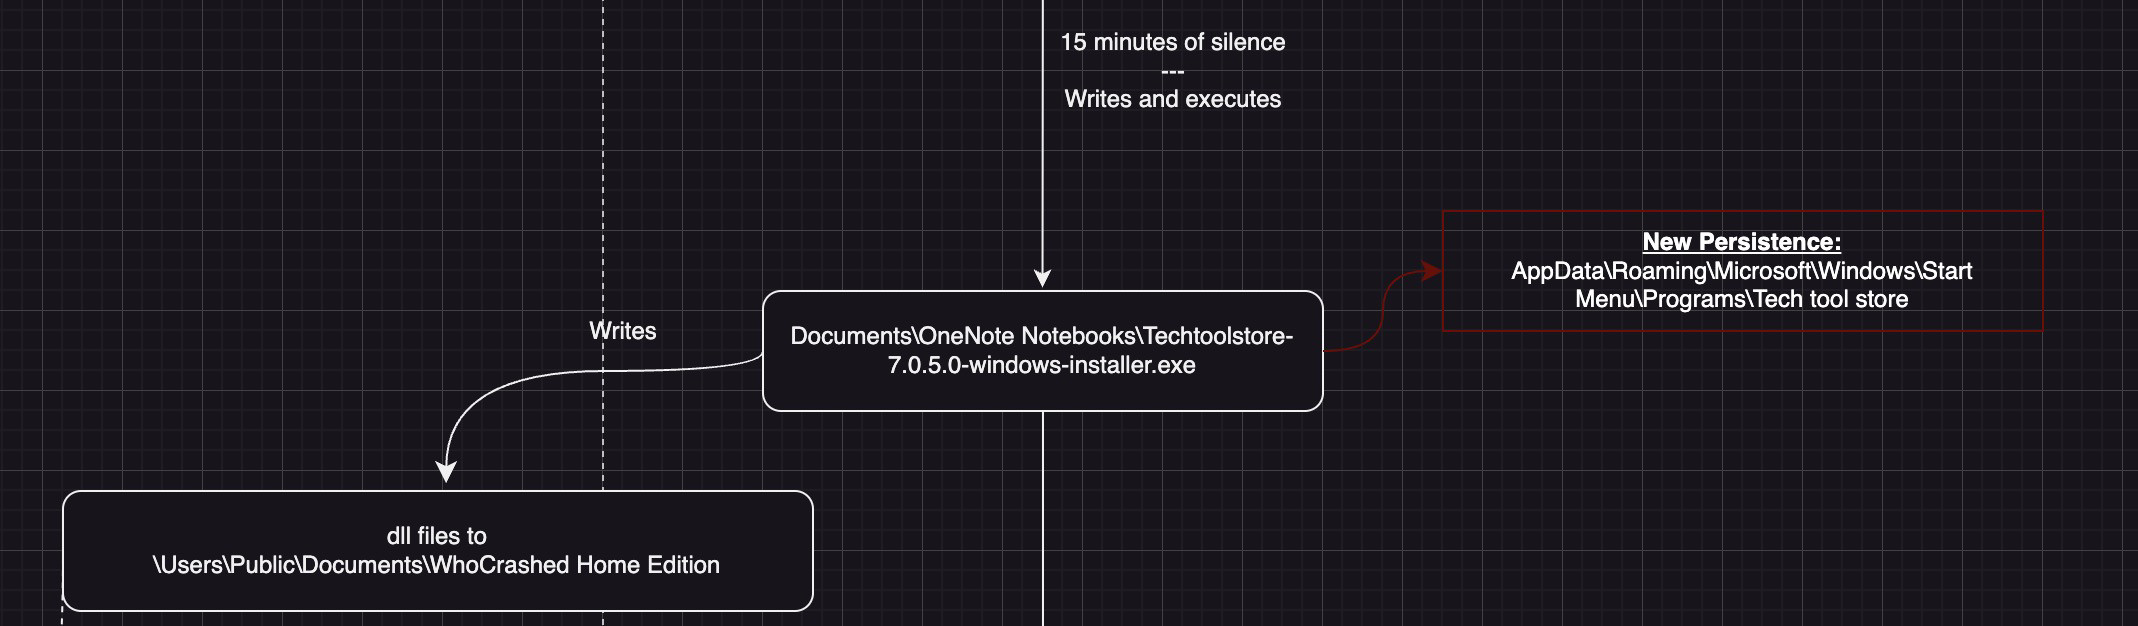
Client32.exe then takes screenshots, submits data to the C2 and is silent for 15 minutes. At this stage, I believe there was human interaction due to the long period of inactivity.
After 15 minutes, client32.exe is seen downloading and executing Techtoolstore-7.0.5.0-windows-installer.exe in the Documents\OneNote Notebooks directory.
This .exe appears to be a Dropper/Crypter, designed to deposit its payload into C:\users\public\documents\whocrashed home edition
The payload in this case, is a host of .dll files accompanied by a RawDigger.exe.
Researching RawDigger.exe shows that it’s a legitimate application used to analyze and interact with camera raw files. More searching turns up this interesting article from Trend Micro
The report matches a lot of the artifacts in this investigation, however in this case, NetSupport is the one that dropped RawDigger, not the reverse.
With this report, it became clear that this is a legitimate installation of RawDigger, that has been modified. So what was modified?
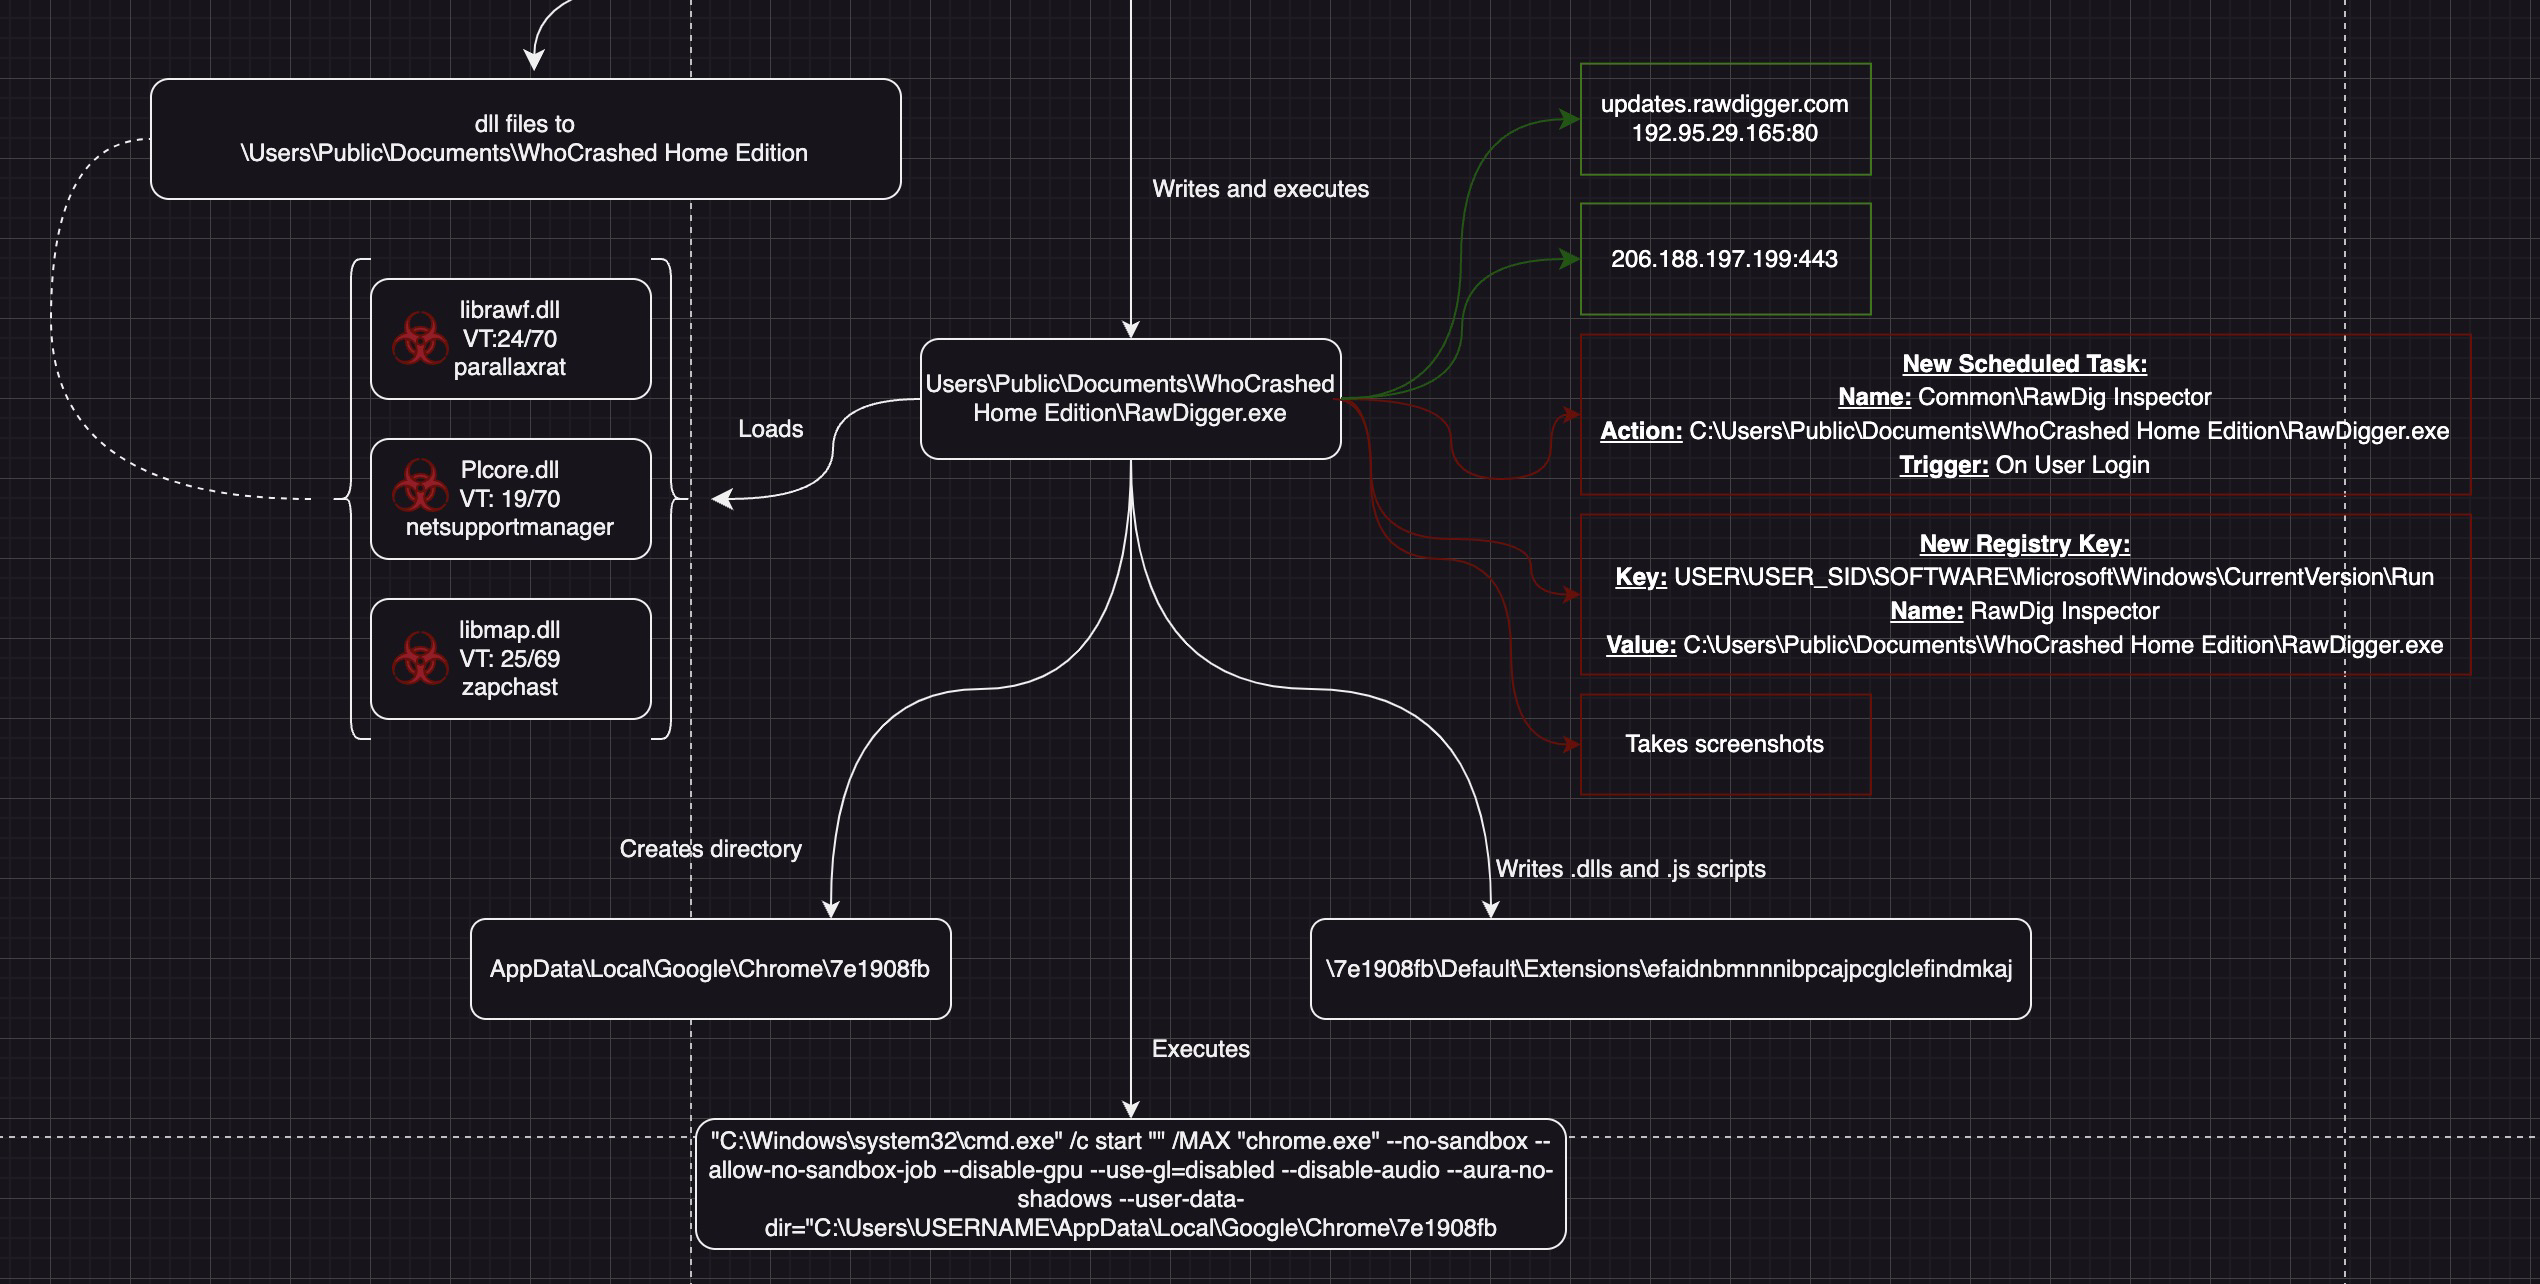
According to the article, the malware includes 3 trojanized/malicious .dll files.
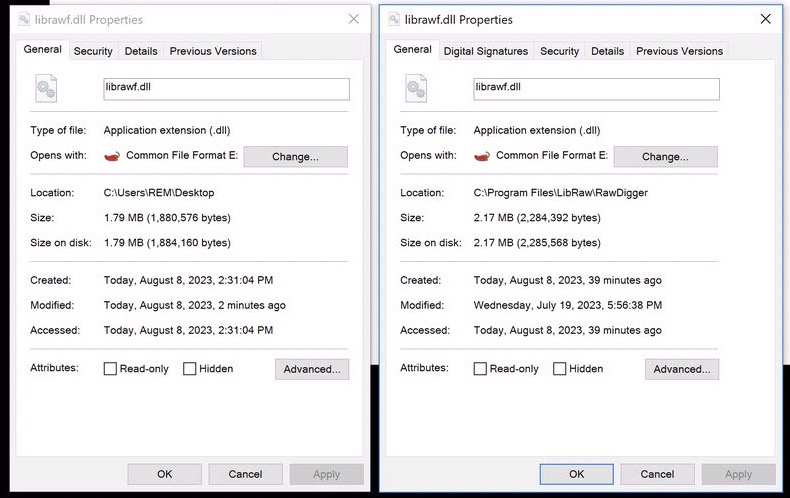
The first, librawf.dll is named to mimic the legitimate librawf.dll that’s signed, and included with RawDigger.exe.
This copy is not signed, which is a strong indicator that the file is either unique, or was modified. Additionally, the file sizes do not match. Malicious librawf.dll is on the left, and legitimate librawf.dll is on the right.
Additionally, the tainted install creates persistance in the form of a Run registry key(which will be executed on reboot) and a scheduled task set to run when the user logs in. Both persistence items are set to trigger RawDigger.exe. Then, RawDigger is also see contacting a C2 server and we also see our second legitimate DNS name contact, this time for updates.rawdigger.com. This could be a second interesting detection or threathunt pivot point.
Finally, RawDigger creates a new Google Chrome user folder, drops some extension files into it and then executes chrome under that user profile. The extension ID here matches the legitimate Adobe Reader Google Chrome Extension, however I have my doubts that this is what is being used here. The TrendMicro article details the malwares interest in crypto jacking, and although the files on the host in question were not available at the time of researching this article, my best guess is this extension was dropped with the goal of pilfering a variety of crypto related information.
Librawf.dll is designed to load and execute code inside of plcore.dll
Accoding to Virustotal, plcore.dll is associated with NetSupport and analysis shows that it will be responsible for executing some interesting code.

Breaking it down a little further, we see that plcore.dll is the one that actually connects to the C2, takes screenshots and is also responsible for loading and decrypting some bundled shellcode.
This also aligns with the Trend Micro article.
Let’s dig a little deeper with some dynamic and static analysis!
If we compare our RawDigger.exe payload to the article, we would expect to see a file containing the shellcode.
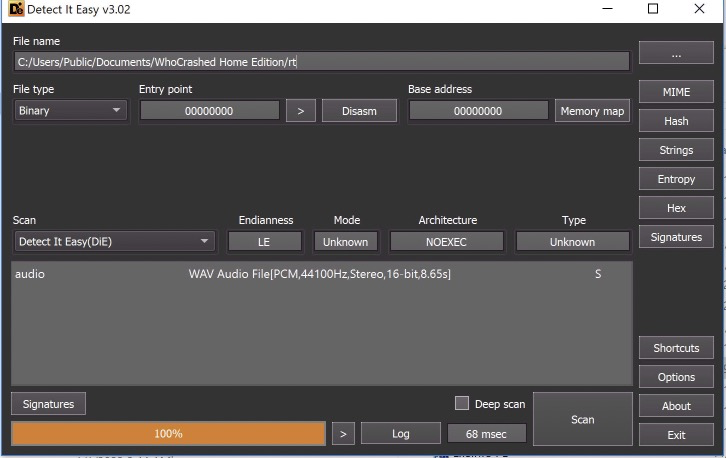
In our case, it’s the ‘rt’ file. It is a two character filename in the same directory, with no file extension and has similar properties to the shellcode file mentioned in the article.

We can check this file to see if its as expected. In the article the file is designed to mimic a .wav file with its magic bytes. So if ours has the same interesting detail, we can feel pretty confident that its the same/similar. DetectItEasy agrees.
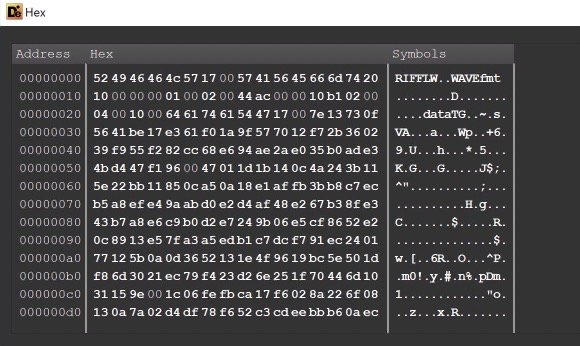
So what’s in this ‘.wav’ file?
Let’s open the debugger and find out how it’s involved with RawDigger.exe.
Since we know we need to read/load a file, we can assume api calls such asCreateFileA and ReadFile are most likely called. So we will start with those. Spoiler alert, it’s CreateFileA and ReadFile.
By loading RawDigger.exe into x32dbg and letting it rip, we can then set our breakpoints.
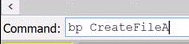
Let’s start with CreateFileA and ReadFile.
It’s as easy as running ‘bp CreateFileA’ and ‘bp ReadFile’ in the x32dbg command prompt

Now that our breakpoints are set, we can hit ‘Run’ and see what we get.

Huzzah!
Now we want to run this back to the code we are actually interested in.
By ‘Stepping Into’ this call, and then ‘Executing until Return’ we will find our way back to plcore.dll

Now, ‘Stepping Over’ this call will take us back to plcore.dll
SUCCESS!
From here, we can click on the little dot next to the memory address for CreateFileA and set ourselves a better breakpoint.
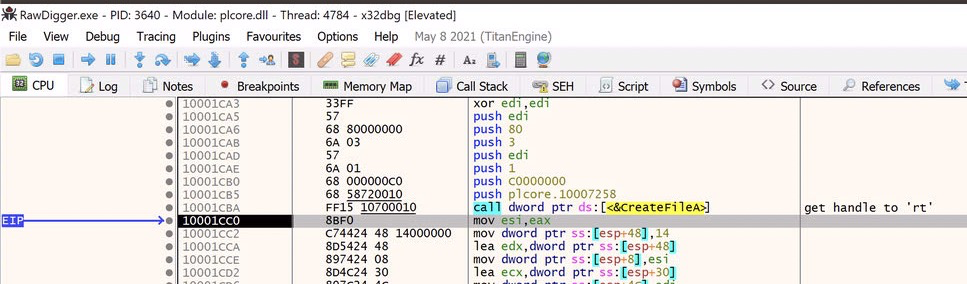
Now, when we lookup the api documentation for CreateFileA, we can see that the expected input is a filename, desired access, security attributes and other parameters.
The return value, if successful, will be a handle to the requested file.
So how do we know we are opening ‘rt’ and not some other uninteresting file?
There are a couple of ways for us to verify this.
First, let’s look at the lpFileName parameter passed to CreateFileA

If we right click on this instruction and choose ‘Follow in Dump - plcore.10007258’ we can view the in memory value that’s being passed to CreateFileA
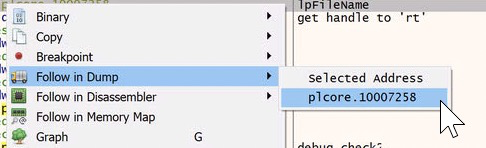

‘rt’ !
However, what if we didn’t know what file we were looking for? Perhaps seeing ‘rt’ here wouldn’t mean much to us.
Well, we could also load plcore.dll into a decompiler like Ghidra or IDA and view the value there. However, why don’t we just work with what the windows api is giving us.
The handle to the file!
It was returned by CreateFileA and is stored in the EAX register, which is commonly where function return values are stored.
We can simply go to the ‘Handles’ tab in x32dbg, right click and select ‘Refresh’, scroll down until we find our handle, in this case its ‘2B4’ and validate the file path.


So now that we know what file we are for sure working with, we need to actually read the file contents into memory. We will look to ReadFile to accomplish this.
However, ReadFile, needs somewhere to store the contents, so some memory must be allocated first. Interestingly, this is accomplished by a separate function in the malware, shortly before ReadFile.

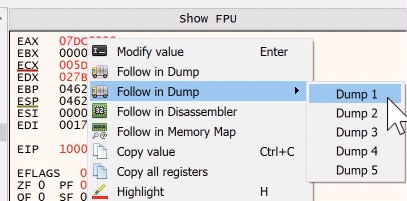
I have renamed this function to make its purpose clear. All it does it allocate a buffer of a supplied size. The buffer location will be stored in EAX upon completion.
Stepping over this function one time and then right clicking on the value in EAX and selecting ‘Follow in Dump - Dump 1’ will take us to an empty section of memory, where we can watch some magic happen.

Now if we look just below this function, we can find and set a breakpoint on ReadFile.
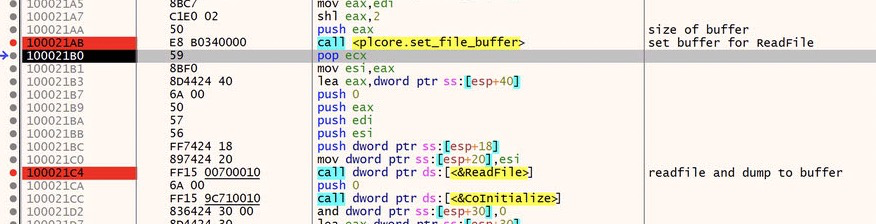
And if we run until we hit that breakpoint and then step over it, we will see the memory region populate with the data from the file.
Huzzah!
So at this point, we have the contents of the file in memory, and we can assume that at some point, those contents will be used somehow.
This is where things get interesting.
If we scroll ahead awhile, we’ll come to a couple of heap memory related calls. Here, the malware is allocating some additional memory, and then there’s a very interesting instruction shortly after. I have added some comments to the code to help clarify what is happening.
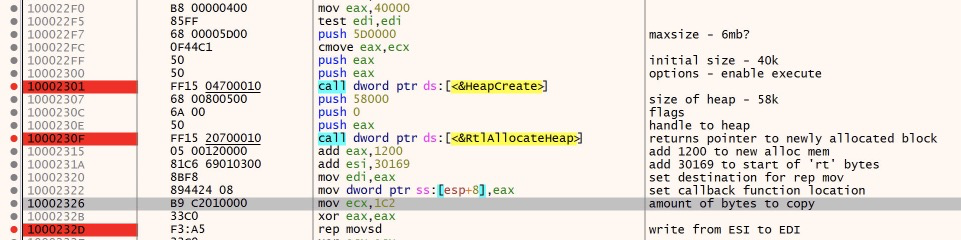

Here’s what is happening:
First, a section of heap memory is created by HeapCreate, with a size between 40k and 6MB. Then, RtlAllocateHeap allocates 58k of this space by accessing the heap handle returned by HeapCreate. Lastly, the instructions after RtlAllocateHeap setup the source, destination and amount of bytes to copy.
The ‘rep movsd’ instruction is a ‘repeat’ instruction, that moves data from source(address specified in ESI) to destination (specified in EDI) until the counter (specified in ECX) decrements to 0.
The goal of this instruction is to copy data FROM the contents of ‘rt’ in memory, to a new section of memory. It does this in 4 byte chunks, for each ‘movsd’ instruction. the ‘rep’ will simply repeat the process as many times as needed instead of listing out hundreds of ‘movsd’ instrucitons. This data is additional code and it will be responsible for copying and decrypting the rest of the contents of ‘rt’. Let’s see what this looks like in action.
We are going to run the code up until the ‘rep movsd’ instruction and then set a breakpoint on the destination memory address and watch the bytes flow in.
Once we are at the ‘rep movsd’ instruction, we can right click on ESI and EDI and choose ‘Follow In Dump - Dump 1’ and ‘Dump 2’ respectively. This way we can validate the data being written.
Next, right click on the memory address in Dump 2(EDI) and choose ‘Breakpoint - Memory, write - Restore on hit’. This will allow us to step through each byte written.
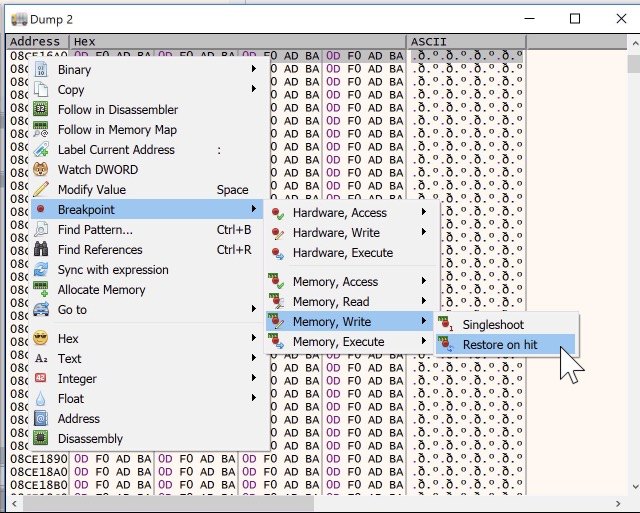
Lastly, to make things easier to follow, we can right click on Dump 1 and Dump 2 and choose ‘Detach’ and then align them next to each other while we debug.
Now, we can simply hit Step Over a few times and see what happens.
Here we can see the data being written, and if we look at ECX, EDI and ESI, we can see ECX being decremented by 1, and ESI and EDI being incremented by 4 as it copies 4 bytes each time.
Now we can go to the breakpoints tab and remove our memory breakpoint and step over ‘rep movsd’ to copy the rest of the data.
Here we want to take note of the start of this copied data, as it will come into play next. In our case it’s ‘08CE16A0’.
At this point we are approaching the most interesting bits!
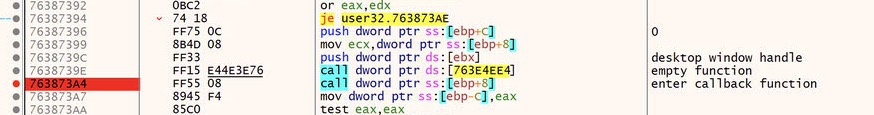
We will scroll down a little bit and look at 2 interesting calls: GetDesktopWindow and EnumChildWindows.
Normally, we would not care a lot about the contents of Windows API calls, only the parameters pushed and the values returned. However in this case, as I was debugging the sample, I found that stepping over EnumChildWindows jumped me ahead in the process, past the point of C2 communication. Clearly something suspicious is happening in this API, so let’s dig deeper.
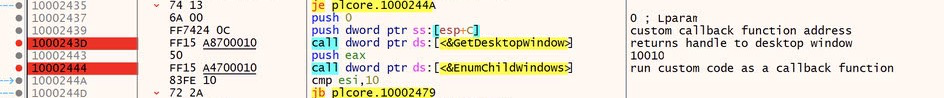
Looking at the parameters pushed to these APIs, there are two being pushed before GetDesktopWindow, however this API doesn’t actually take any parameters. It returns a handle to the ‘Desktop Window’ which is the parent window/desktop over which all other windows are overlaid. EnumChildWindows takes this handle and will enumerate all of the open windows on top of the desktop window. This handle is the ‘push eax’ instruction, as EAX contains the return value of GetDesktopWindow.
The other parameters, pushed before GetDesktopWindow, are actually being passed to EnumChildWindows and they are, Lparam and lpEnumFunc.
Lparam(an optional parameter) is 0 here so it is not interesting, but according to the API documentation, lpEnumFunc is an application defined ‘callback function’.
Even better, the doc states: “The callback function can carry out any desired task.”
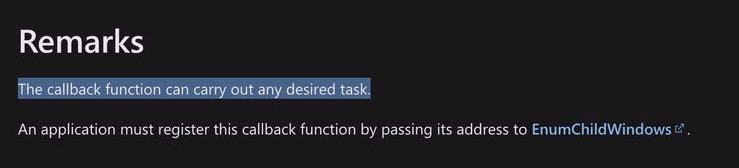
That sounds like it could be pretty interesting!
So let’s step up to GetDesktopWindow and see what we get for parameters.
If we take a look at the callback function push instruction, it’s a pointer to a memory region, so we need to look at the stack to see the real value.
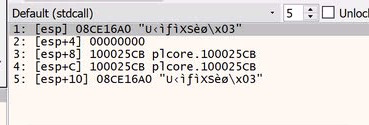
Look familiar? It’s ‘08CE16A0’ ! This is the section of code that was just copied from the ‘rt’ file!
So now we know that if we simply step over EnumChildWindows, that callback function will likely be utilized somehow and we will be left in the dust.
Let’s step into it!
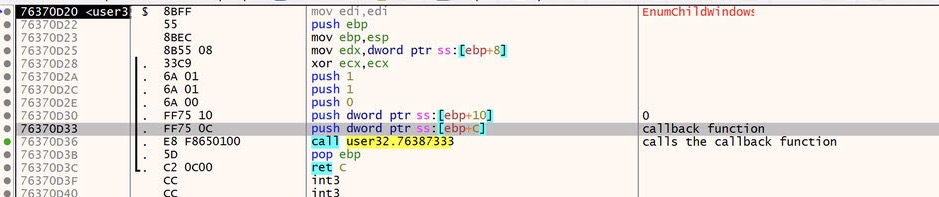
Stepping into the api call gives us some additional push instructions, one of them being the memory address of the callback function, and then the actual call to EnumChildWindows.
Lets skip ahead to the call function and step into it.
Not a lot of interesting instructions happen here, however not far from the start of the function we see what we came for.
The first function shown here simply returns and doesn’t seem to have a purpose that I can discern. The second is actually the call to our callback function!
Let’s skip ahead to this call and then step into it.
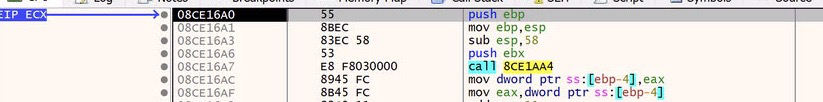
Ah ha! As expected. We are now in the callback function that was copied over from ‘rt’.
This functions primary purpose, as we’ll see shortly, is to allocate memory, copy the contents from ‘rt’ and then decrypt them.
It does this in a few different loops, and I’ll end the blog with a quick breakdown of the copy/decrypt functions.
Scrolling down we will see two function calls preceded by a couple of pushes. These are our targets. I have added some comments and renamed the functions to add some clarity.

These 2 functions are looped over 5 times until all the data is copied and decrypted.
The first function specifies the size of data to copy, the source to copy from and the destination to copy to. The decrypt function then takes the same size, the start address of the newly copied data and decrypts it.
Let’s run through the functions 1 time to see what we get.
I’ll have the source data and destination address split out into detached dumps.
MZ! That’s a PE file!
Looks like this will likely be executed at somepoint and there’s a good chance this PE file is responsible for the C2 and persistence we saw in the diagram earlier.
Stay tuned for part 2, where I hope to dive a little deeper and continue unraveling the malware in this debugging session.
Thanks for reading! :)