Fake Software Abusing Real Software For Fun And Profit - Part 2!
Picking up where we left off, from Part 1.
After the copy/decrypt loop, there is another set of loops to copy additional code to the current region of memory(where the callback function is running).
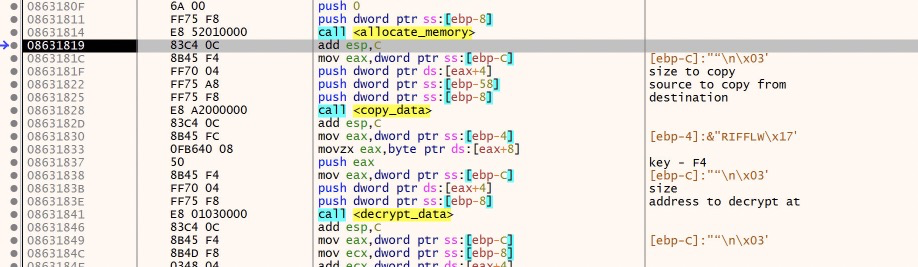
Nothing new here that we haven’t seen already, so I will skip past these loops by locating the start of the loop, and following the jump instruction to the end and choosing ‘Run Until Selection’ from the debug menu.
After this second copy and decrypt loop, the malware jumps to this new section of code:

This seems a bit unusual, so let’s follow it and see what else is in store. I have renamed the function calls and added comments to help guide our walkthrough.
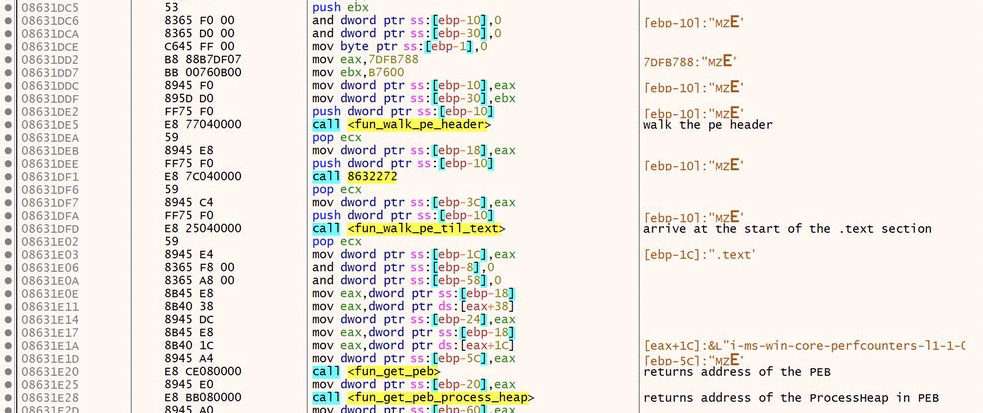
The initial calls here are fairly uninteresting. This code is walking the PE header and finding the .text section. It then loads the Process Environment Block(PEB) and returns the address of the ProcessHeap. The PEB is a set of data points about the process that is used by Windows. The ProcessHeap can be used to check for a debugger, however that doesn’t seem to be the purpose here. It looks like this is being setup to load API calls via hashing, which is a common way to hide the malwares capabilities from an analyst or sandbox.
The next functions confirm this hypothesis.
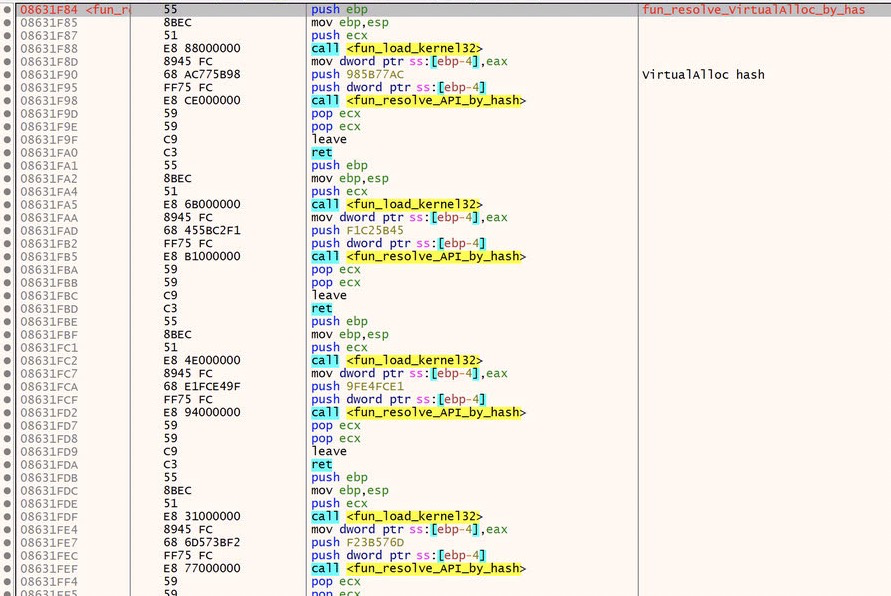
Each API is resolved by first building the string ‘kernel32’ and then loading the memory address for kernel32.dll. Then the malware uses a pre-defined hashed value for each API it want’s to call. It provides this as an argument, and the function ‘fun_resolve_API_by_hash’ is responsible for equating that to a string value and returning that value.
First, we see the malware resolving VirtualAlloc. VirtualAlloc is a very common api used for allocating memory. It is very often used in process injection, process hollowing and other malicious techniques.
After we step over the first call to ‘fun_resolve_API_by_hash’, we can easily see the result in the EAX register

Awesome!
The next function will resolve VirtualProtect, which is an API used to change or set the protection on a region of memory. VirtualProtect is very often used in combination with VirtualAlloc. So I am not surprised to see it here.
The presence of these two APIs give me greater confidence that the PE file we loaded in the last blog will be executed soon. Let’s keep digging.
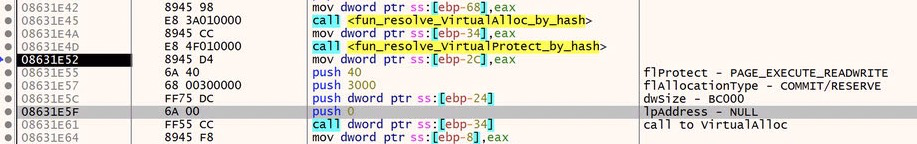
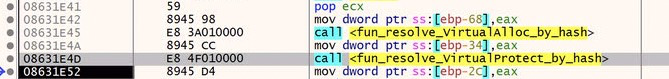
Next we see some interesting arguments, followed by a call to a local variable. What are we calling? Well, if we look at the instruction below the VirtualAlloc resolution, we see that EAX was moved into local variable ebp-34, which is the variable that we are calling.
Let’s look at the arguments supplied to VirtualAlloc.
The first, lpAddress is set to 0. This is an optional argument and setting it to 0 will tell Windows to choose the memory location automatically. The second, dwSize, is how much memory to allocate. The third, flAllocationType, is the type of memory to allocate. In this case it is set to 3000, which, according to the API docs, translates to COMMIT and RESERVE. The purpose of this is not particularly important here. The final argument, flProtect, is very important. The value of 40 resolves to ‘PAGE_EXECUTE_READWRITE’ which is key for process injection type activity. The malware needs memory allocation that can be written to and then executed.
VirtualAlloc returns the memory address of the newly allocated memory. Let’s step over this call to get that value from EAX.

Awesome.
Then the malware stealthily copies the PE file from the first blog into the newly allocated memory from VirtualAlloc.
This is interesting because it is working with the bytes of memory directly instead of abstracting to an API call. This is likely a great way to remain hidden and avoid suspicion by using API calls that may be hooked or monitored by an AV/EDR or sandbox.
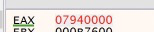
The malware then proceeds to load some additional API imports.
First it resolves GetModuleHandleA, LoadLibraryA and GetProcAddress via hash, similarly to VirtualAlloc and VirtualProtect.

These APIs are important for loading or locating already loaded dlls. This is a common technique for obfuscating which suspicious windows API calls are being used.
First it attempts GetModuleHandleA on kernel32.dll, this API call will get a handle to a loaded dll, if that dll is already loaded. If it is already loaded by the process, the return value is a handle to that module. If not, it is 0. In the malware code, it checks if the result is 0, if it is 0, the malware will attempt to manually load kernel32.dll via LoadLibraryA, which will load a dll based on path provided.

The ‘cmp‘(compare) followed by a ‘jne’ (jump if not equal) instruction after the GetModuleHandleA call check if the return value is 0, if its NOT 0, it jumps past the call to LoadLibraryA.
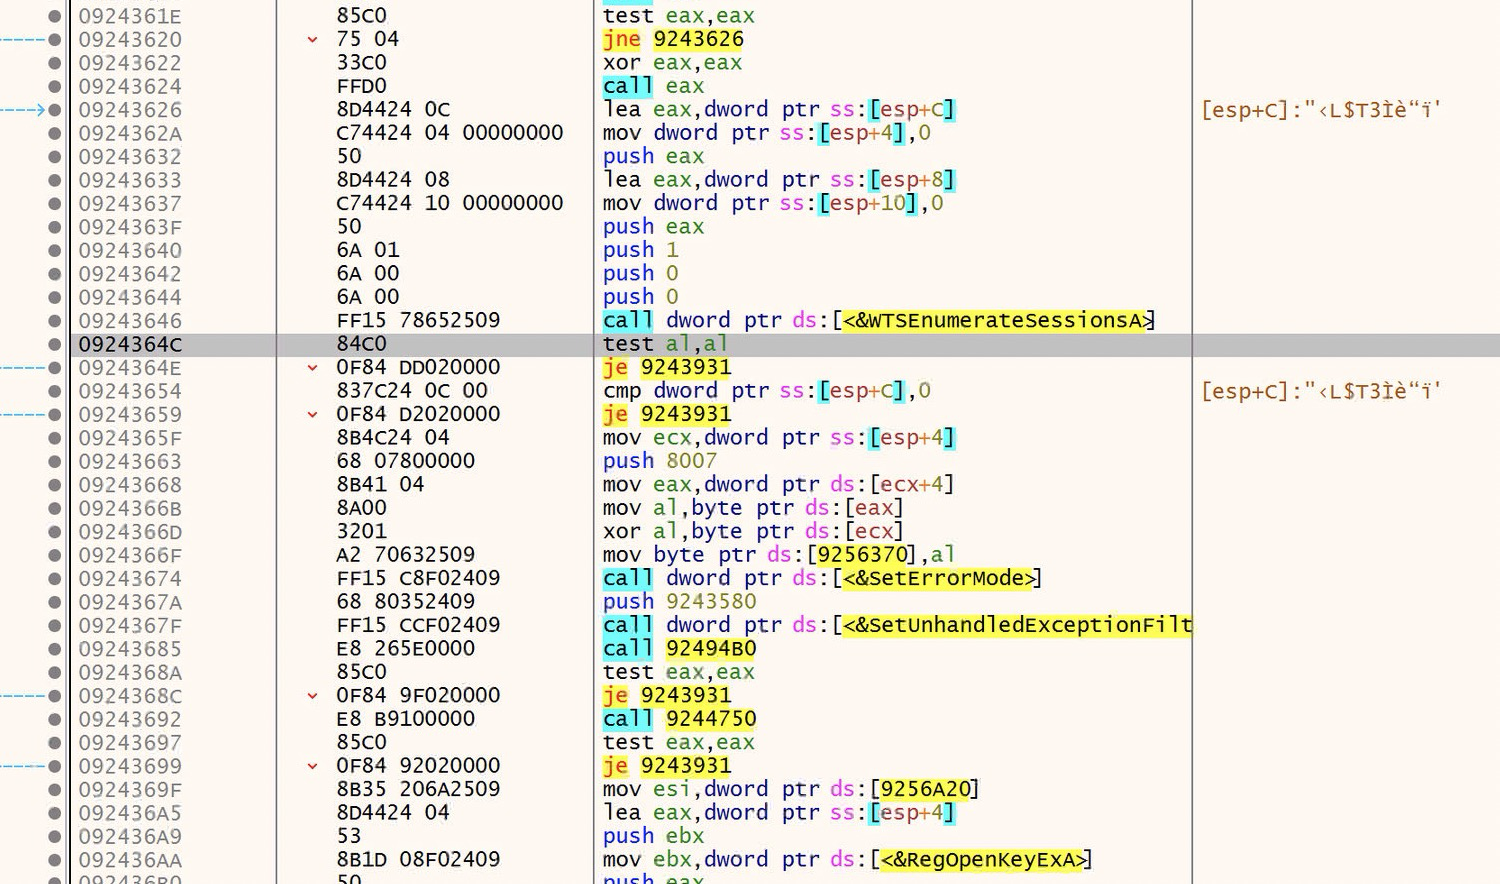
After getting the handle to kernel32.dll, the malware uses GetProcAddress to cycle through all of the exports of kernel32.dll

The malware then repeats this process for the following dlls: user32.dll, advapi32.dll, shell32.dll, ole32.dll, oleaut32.dll, crypt32.dll, bcrypt.dll, and wtsapi32.dll.
It then walks over every byte of the new PE file in memory. There doesn’t seem to be much of a purpose to this function, it could be verifying the total size, or some other attribute, I am not entirely sure.
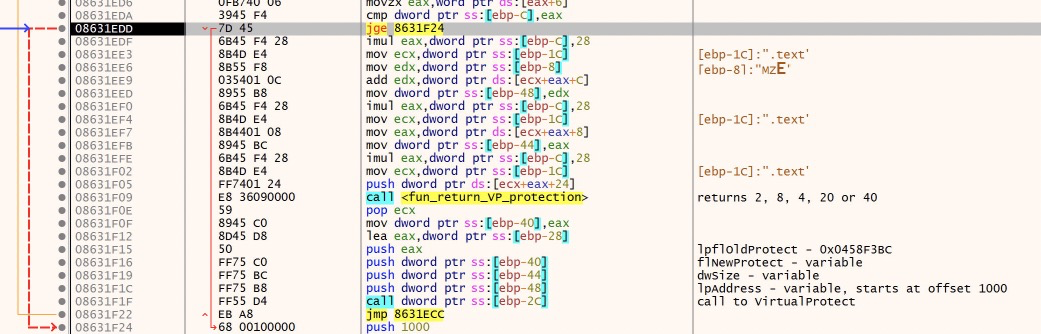
Next, the malware is going to call VirtualProtect. Let’s break down the parameters supplied to VirtualProtect:
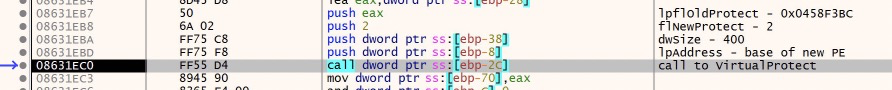
lpAddress is the base address to adjust the memory protection on. dwSize is the size in bytes to adjust. flNewProtect is the type or option of memory protection to apply. In this case it’s specified as ‘2’ which is equal to PAGE_EXECUTE_READ. lpflOldProtect is a pointer to a location where VirtualProtect will store the previous memory protection value. Currently this is an empty byte in memory.
Stepping over this call populates the empty byte in 0x0458F3BC with ‘40’ as expected, because this was the memory protection set by VirtualAlloc. Additionally if we look at the memory region in the Memory Map, we can see it has indeed been set to Read only.

Next we come to a function that appears to be purposed to only return the value ‘20’, ‘2’, or ‘4’. This is used in the following calls to VirtualProtect as the type of memory protection to apply.
This loop returns the values in this order: 20, 2, 4, 2, 2. This correlates to RX, R, RW, R, R. I am not entirely sure of the purpose of this varied level of protection. The function appears to be setting these protections on different sections of the PE file in memory.
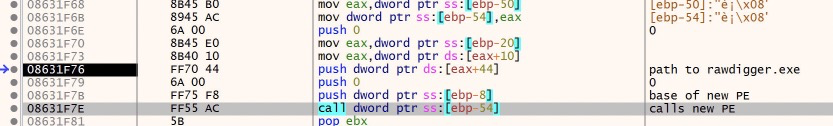
Finally, we approach the end of this section of code as the malware actually calls the entry point of the new PE file.
At this point, we are actually in the middle of a lot of boilerplate code that we don’t care about at all, however that’s not very clear to us, because x64dbg is not doing any signature matching to label the functions we have in front of us. I loaded this pe file into Ghidra and let Ghidra work its magic(out of scope here, sorry!) and then I wrote a simple python script to export all of the function names and addresses from Ghidra into a .txt file that x64dbg can use to rename them all, which will make it much easier to understand. The script can be found HERE.
So now what we see is this.

It’s important to cover, though I won’t go into it here too much, but if we were to look at this in a decompiler like Ghidra, we would see a lot of boilerplate code added at compile time by Visual Studio. A great example of what this looks like(in IDA) can be seen HERE. This awesome video from OALabs will give you a great idea of how to idenfity this code as well as how to identify the main function.
In this case, the main function is nestled amongst the runtime code.
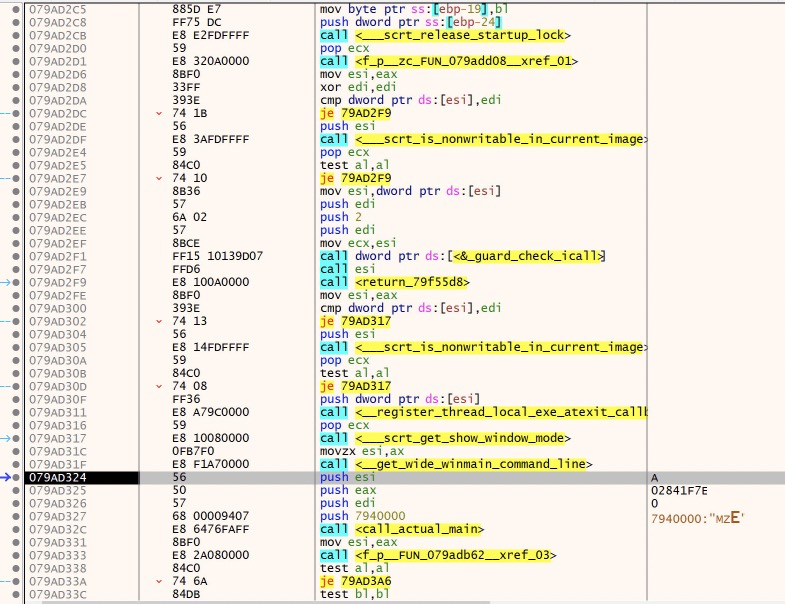
Inside main there is not a lot going on at first glance.
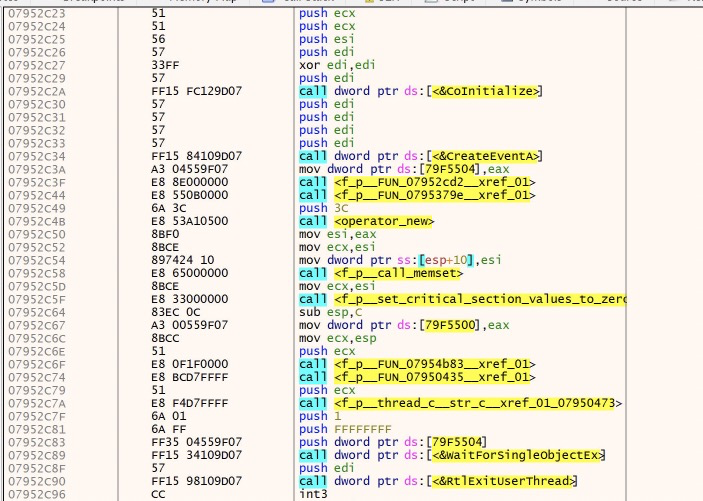
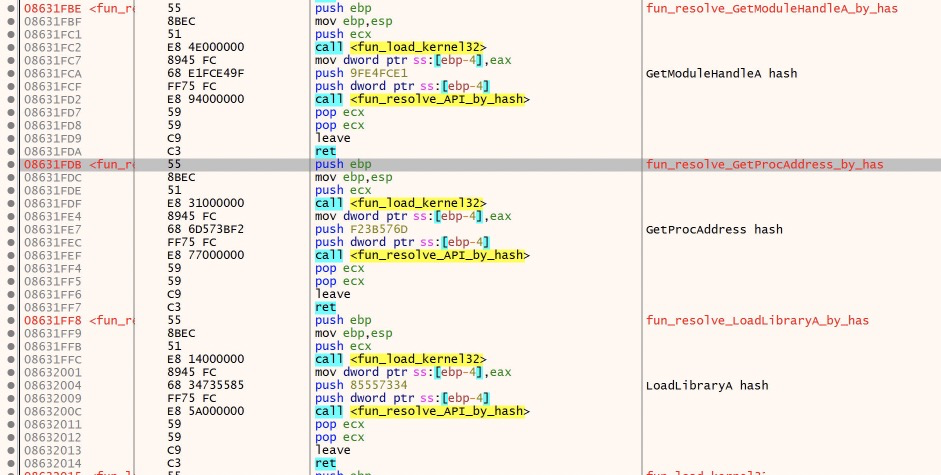
CreateEventA takes all 0s as its parameters, and returns a handle to an event. At the end of main, WaitforSingleObjectEx will use this handle for execution.
Inbetween these two API calls, quite a lot happens inside nested function calls. I spent a fair amount of time trying to understand it and have come up pretty short, but here’s what I was able to figure out.
The function before WaitForSingleObjectEx is responsible for creating multiple threads, and in these threads the malware appears to be executing/initiating its built in functions. Additionally, it seems to be allocating and writing a new PE file. Though I was not able to pin that down very well. However, I will still show you how we can dump it in the end :)
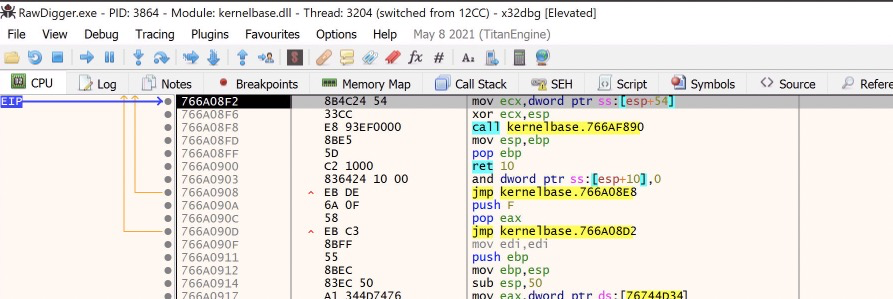
As part of my analysis I found that when I stepped over WaitForSingleObjectEx, the debugger would jump to a system dll and hit an exception. That gave me the clue that something was happening that I wasn’t seeing.
So, let’s take a snapshot right before we execute WaitForSingleObjectEx and then step over it to see what happens.

RPC_S_SERVER_UNAVAILABLE
This would indicate to me that there is code somewhere trying to connect to…something…and failing. Which would make sense because this VM has no internet access!
Now, knowing what I know about the code before WaitForSingleObjectEx, the malware is creating and executing threads, and WaitForSingleObjectEx is also used to do exactly that in this case. If we wanted to intercept that, we can set a new break event in x64dbg to break on ‘Thread Entry’ and then step over WaitForSingleObjectEx, break on the new thread and then trace that function back to see where the thread is created. But this blog is long enough already :D One thing that is interesting is if you were to step through the thread creation loop, you can see the malware initializing/executing built in funcitons as mentioned in the Trend Micro article.


Back to RPC SERVER UNAVAILABLE, here we find oursleves inside kernelbase.dll, not the malicious code.
If we go to the call stack tab, we can see ‘who called who’ and trace back to the malicious code. Skipping past the system dlls we can see a new section of memory in play

Double clicking on 0910364C will bring us to this new section of memory, which happens to be a PE file(checking the memory map will confirm this).
If we step through or scroll down through the following instructions we’ll see some very interesting API calls like RegOpenKeyExA, GetVolumeInformationA, GetCommandLineW and inet_addr, which if we step up to this call we will see a very interesting value
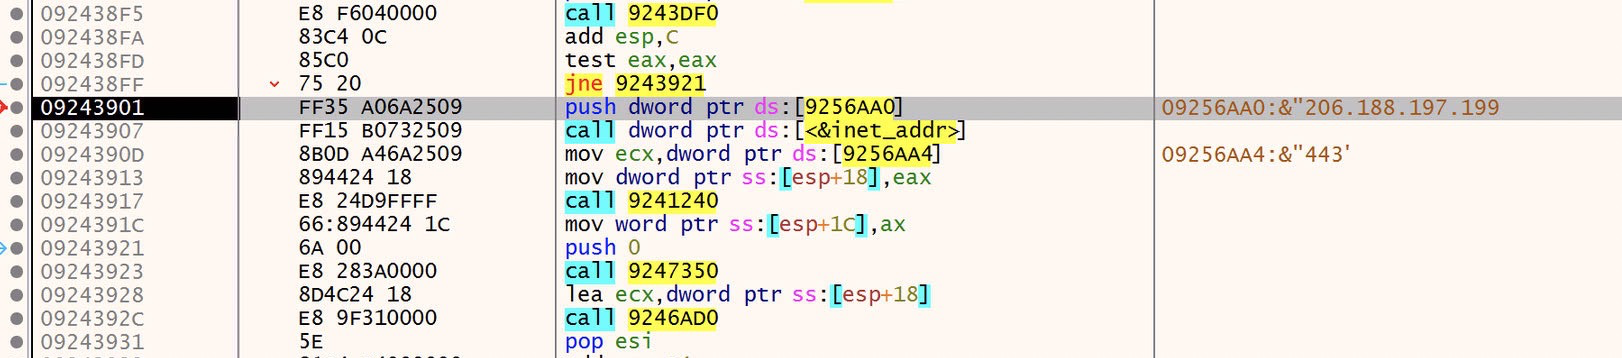
That ip looks familiar, in fact its one of the C2 ips we saw from part 1! As well as a port number, 443.
It looks like we are most likely in the final payload. Let’s finish our current journey by dumping this PE file and seeing what we are working with.
While we are in this section of code we can simply right click on one of the memory addresses and choose ‘Follow in Memory Map’
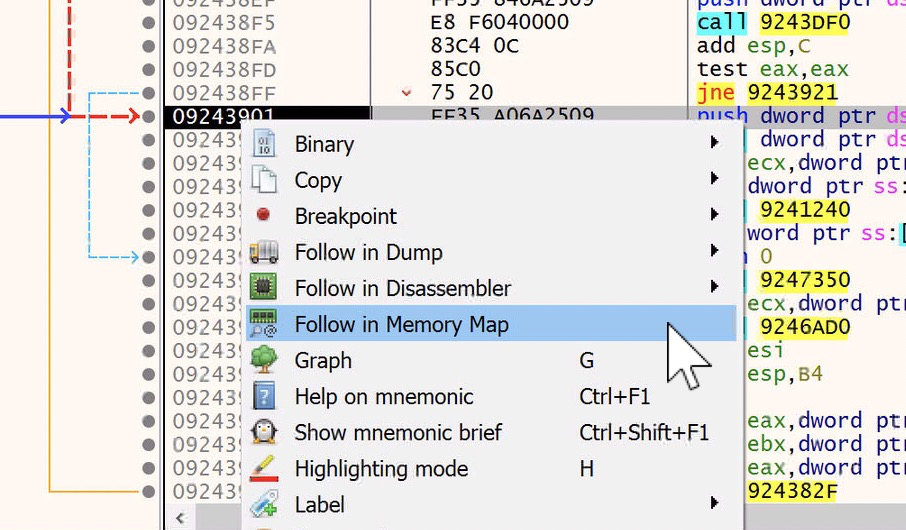
This will take us to a section of Executable memory.

From here we can right click on the highlighted memory region and choose ‘Dump Memory to File’
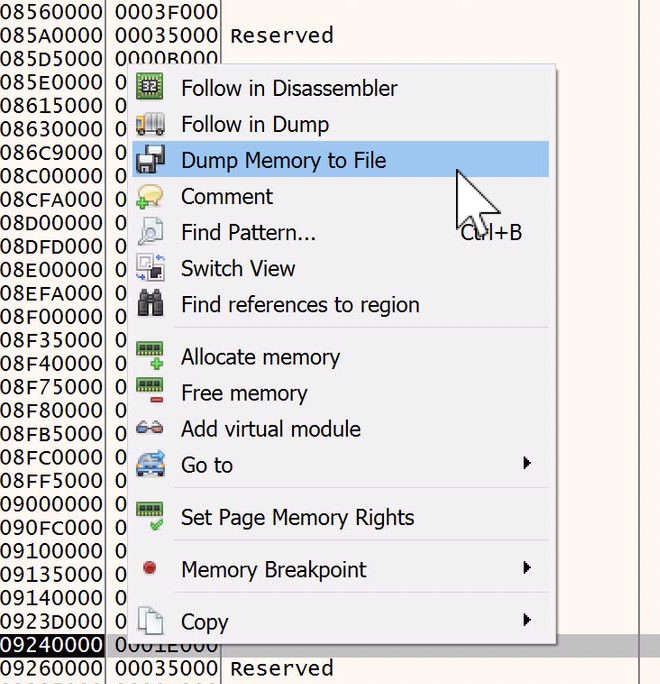
I will dump it to the desktop for simplicity’s sake, and will keep the auto generated name the same, because it includes the base memory address where the PE file resides. This will come in handy shortly.
Now we need to do some fixing up of the dumped file before we can make use of it.
We will use PeBear to accomplish this. An excellent example of this process can be found HERE around the 20 minute mark.
Load the dumped file into PeBear and select the Section Hdrs tab
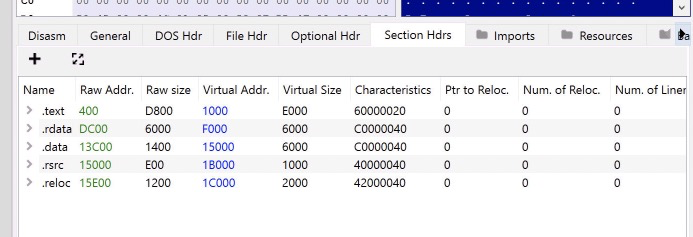
You’ll notice that the Raw address and size do not match the Virtual address and sizes values. This is what we need to fix. This is a result of the file being mapped into memory and then dumped to disk, as a result, the sections no longer line up correctly. This results in the file not being very readable.
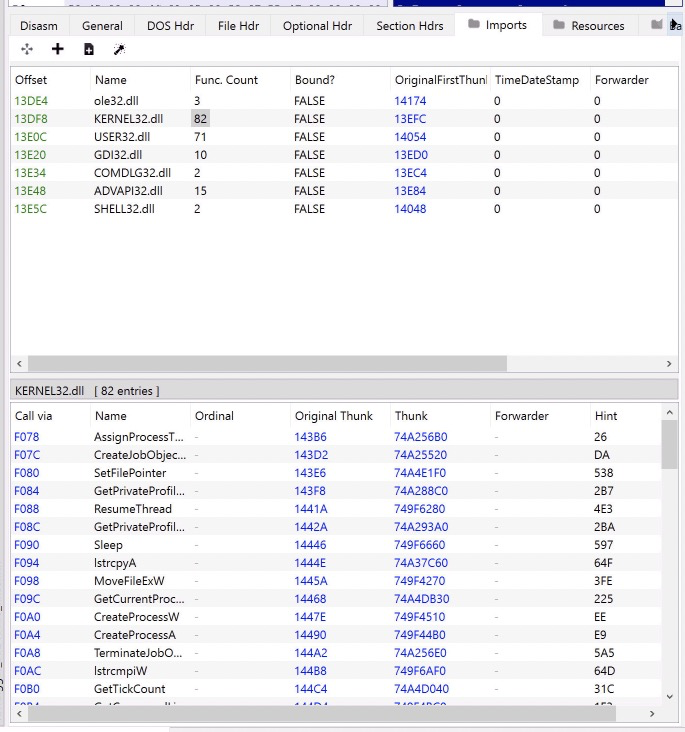
Next lets look at the Imports tab.

This doesn’t look right…. But we will fix that too :)
First, we’re going back to the Section Headers tab, and we’re just going to set the RAW ADDRESS value to match the VIRTUAL ADDRESS values.

Now we need to calculate the size of each section. This is as easy as subtracting one from another in hex values(Windows has a handy hex calculator in the Programmer section of the Calculator)
To calculate the sections we’ll do the following:
.rdata minus .text = .text size .data minus .rdata = .rdata size .rsrc minus .data = .data size .reloc minus .rsrc = .rsrc size .reloc size = .reloc virtual size
Which will end up looking like this

Lastly we need to do one more thing, fix the Image Base of the pe file. Since it was mapped into memory at a specific address, we need to set this so that it loads properly.
Navigate to the Optional Header tab and update the Image Base value to the value from the file name, in this case its ‘09240000’

Now, navigate back to the Imports Tab and huzzah! Imports!
Now that we have a fully formed pe file, we can toss it into PeStudio or DetectItEasy and see if there are any interesting strings that pop out at us. First right click on the file name in PeBear and save the executable. Then load the new file into PeStudio.
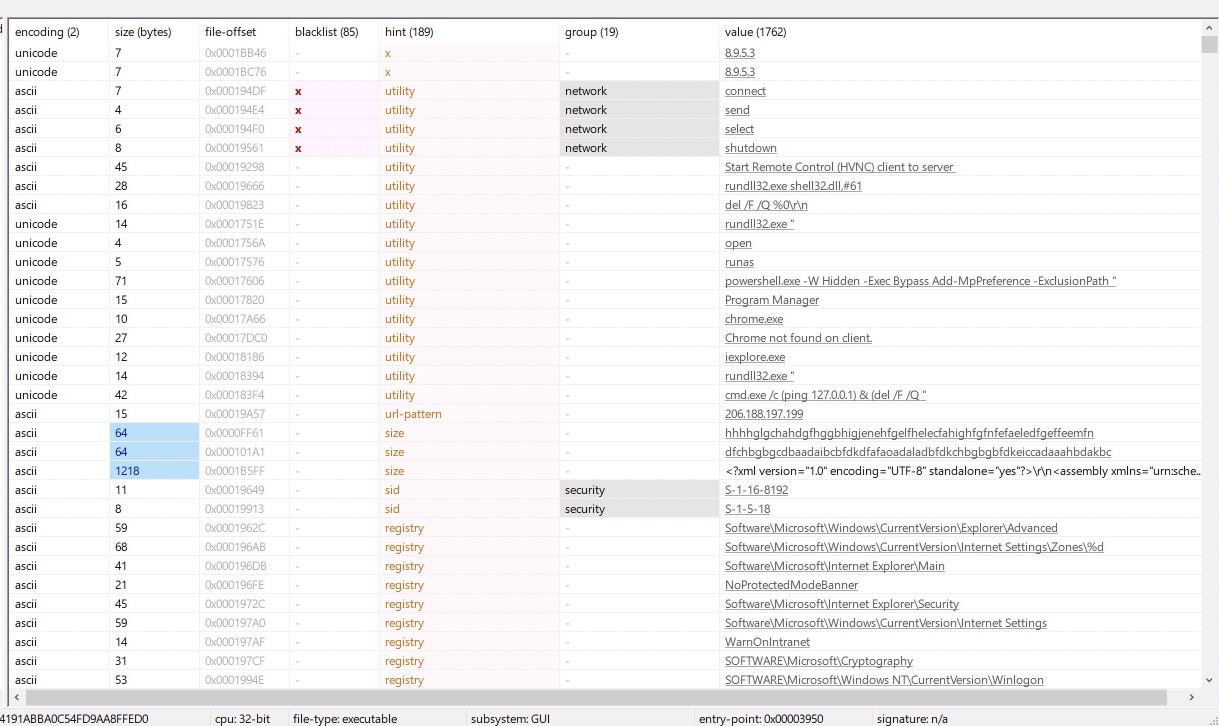
HEY OHHHH look at that!
Command strings, reference to HVNC, reference to loading another dll, powershell command to exclude paths from Windows Defender, and the C2 ip we saw earlier! Based on these and other indicators, It looks like this is a hVNC payload, as mentioned in the Trend Micro article.
From here we could continue to analyze the in memory PE file in x64dbg, or we could load this into a decompiler/disassembler, load it into VirusTotal etc to get more info and intel on this particular sample.
I will end the blog here, but I hope that you enjoyed the analysis as much as I did! Thank you for reading and I’ll see you in the next one!
IOCs:
| Name | Sha256 Hash |
|---|---|
| Version11.exe | 17d384e8b39bb8b0da08c716919ee59eda135cd8d0a34f03cf188893aef9da05 |
| setup.exe | 371eb99803df2ca6481eadd40e176bc3e968238b11d0d7b1001b97455ff4bbe1 |
| rt | 3685155675cd5bc1e0037d522b67b6005d417ae7f6523de725002b129eb893c0 |
| libmap.dll | e9053b628bf89440e0ad4874a5c234fe058539f20f9bf02d36c7492fed70857a |
| librawf.dll | 49d9182ffbbafbeb634c15548a00931a9465e17b1dc5caee995c56b70fa33ec2 |
| plcore.dll | 74081c1779afc036e4dd3ba17111829f1e98ff2dd090362e290359c8e4322188 |
Host based indicators:
Directories:
C:\Users\USER\AppData\loal\Google\Chrome\7e1908fb
C:\Users\USER\Appdata\Roaming\Microsoft\Windows\Start Menu\Programs\Tech tool store
C:\Users\Public\Documents\WhoCrashed Home Edition
Network based indicators:
TCP ports:
443 2006
IPs:
45.61.138[.]73
206.188.197[.]199